We don’t have a strong tactical call now, in part because the S&P 500 is in the middle of our putative 950-1,250 range. However, we don’t expect equities to head to the top of that range until we see rising Treasury yields. Ten-year yields closed last Friday at 2.92%, the lowest since April 2009.
A few thoughts:
We agree that timing the next recession is critical, but let’s forget about calling it a double-dip. If a double-dip is recession within a year of a prior downturn, then the US has avoided it.
The National Bureau of Economic Research (NBER), who arbitrates these things, hasn’t yet decided when the last recession ended, but Dick Berner thinks it will probably say recession ended in June or July 2009. In short, unless you think the US is in recession now, the double-dip’s been dodged.
For the record, the NBER has dated 33 expansions, starting from 1854. Of those 33, three lasted 12 months or less. Another 11 expansions ended in the second year.
In other words, 14 of the 33 expansions were 24 months or shorter. However, only two of those truncated expansions were in the past 75 years.
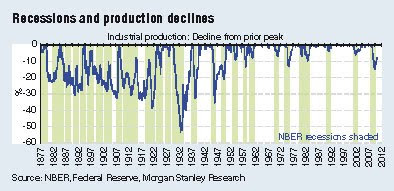
Prior to 1940, recessions were deep and frequent. The first chart shows the decline in industrial production from its prior peak as a measure of recession severity. NBER recessions are shaded. Prior to 1919, the US was in recession almost as often as it was in expansion.
This is certainly a special cycle, but we need to remember that double-dip downturns are rare for modern economies.
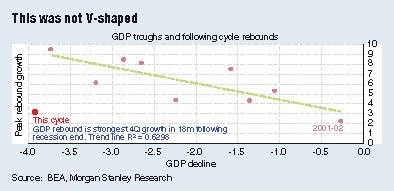
Just as we see nothing to suggest that recession is imminent, we also think the debate about the nature of the recovery is now settled. It was not V-shaped. Using our US team’s June quarter GDP forecast, the recovery looks sets to be the second weakest since 1947 (when quarterly GDP data are available).
The lacklustre rebound is noteworthy given the severity of the downturn.
The second chart shows the peak-to-trough decline in GDP in each US cycle on the horizontal axis, and shows the peak four quarter GDP growth rate in the recovery on the vertical axis. Sharp rebounds typically follow deep downturns, but not this time.
This is strong evidence this cycle is different, and we continue to think that it will be a relatively short and stunted macro cycle.
For now, we don’t see imminent recession. By that we mean likely within the next one to two quarters (the important timeframe given that equities typically look around six months ahead).
However, the declining long-end yields suggest that recession is a live issue, despite equity strength over the past fortnight. We respect the bond market’s macro antennae. Moreover, macro data are continuing to disappoint, as shown in the third chart.
As we’ve argued, at below S&P 500’s 1,000 (say, 950) we think there’s a solid risk-reward trade to play against recession (assuming that one still appears not close). The tactical trade would look even better, in our view, if long-end yields were starting to rise.
Without that value buffer, and with yields falling, we don’t see the case for a strong tactical call. This, as an aside, confirms — yet again — that low rates are not always good for equities. More to the point, falling rates are bad. Of course, through the credit super-cycle, rates and equities were inversely correlated.
However, we think that for the foreseeable future, equities and rates will likely be positively correlated. Falling rates should go hand-in-hand with falling equities, just as they have in Japan for 20 years, as shown in the fourth chart.
Whether the current reporting season will provide significant support is a moot point. We think the key to the reporting season will be the outlook statements, not the numbers reported. It’s early days, but the initial response to the reports have been little change to earnings forecasts.
The fifth chart shows revisions to forecasts over last week; there were downgrades in the prior week.
One final point: while we don’t have a strong near-term call on the market direction, some relative calls are working. Most noteworthy from our view is the outperformance of emerging markets (EM) over developed.
Our framework view is that developed markets (DM) are likely to see extended range trading. For example, the S&P 500 has closed in a 1,000-1,200 range 94% of the time since last August.
While EM may move day-to-day with the DM lead, the EM can sustain trend outperformance. That’s been the story since last August, when the S&P entered its current range.
This article appeared in The Edge Financial Daily, July 20, 2010.
How can I make so much money from the stock market? Koon Yew Yin
-
Another valuable advise by KYY on investing in share market.
*How can I make so much money from the stock market? Koon Yew Yin*
Author: Koon Yew Yin | Publi...


No comments:
Post a Comment